
1. Geographical breakdown of the UK international investment position
The latest available geographical breakdown of the UK’s international investment position (IIP) is for the end of 2013. The geographical breakdown of IIP lags behind that of the current account, as much of the data comes from annual surveys which are not available until 12 months after the reference year.
Direct investment geographical breakdown levels are derived from annual surveys to outward and inward direct investors in the UK. Portfolio investment contains equity and investment fund shares and debt securities which can be short-term (money market instruments) and long-term (in the form of bonds and notes).
Other investment data are sourced as follows:
geographical breakdowns of UK banks’ deposits abroad and loans made abroad are derived from banking data supplied by the Bank of England – this information is also used to apportion securities dealers’ deposits abroad
country breakdowns of UK private sector (excluding banks and securities dealers) deposits with banks abroad are derived from the banking statistics of countries in the Bank for International Settlements (BIS) reporting area
geographical breakdowns of foreign deposits with UK banks are derived from banking data, with foreign loans made to securities dealers apportioned in the same way
country breakdowns of UK private sector (excluding banks and securities dealers) loans from abroad are derived from the banking statistics of countries in the BIS reporting area
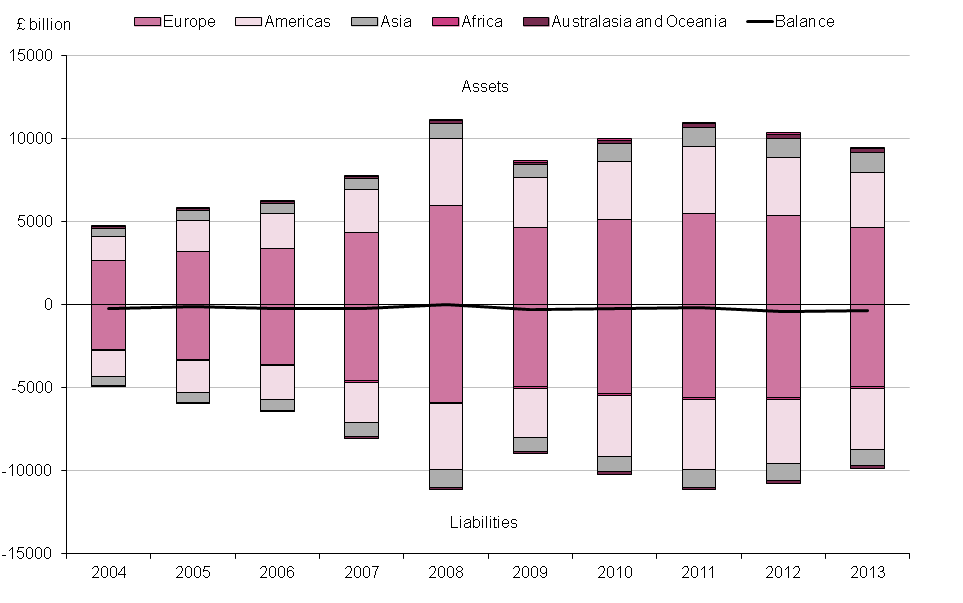
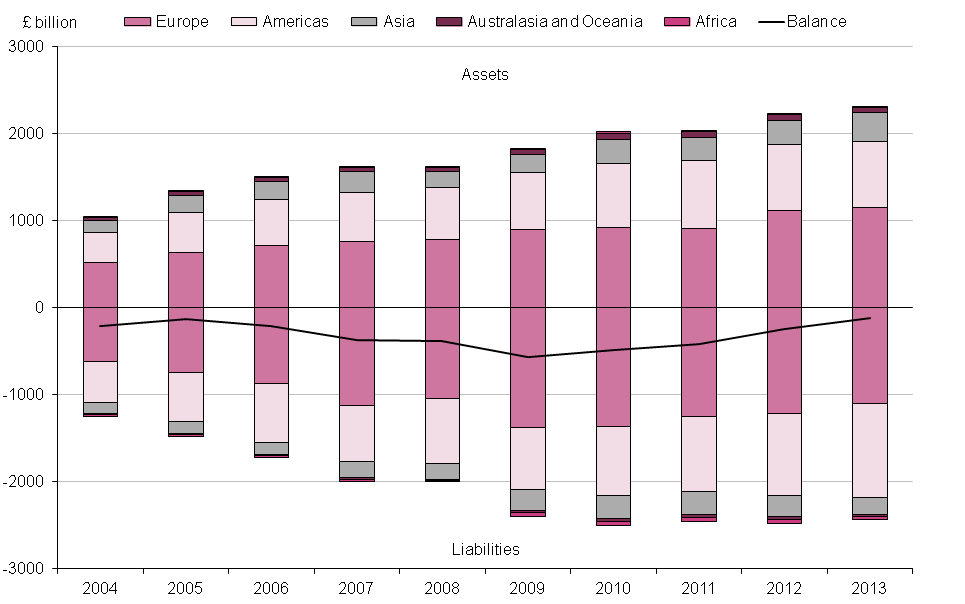
Figure 10.1: UK international investment position, assets, liabilities and balance, 2004 to 2013
Source: Office for National Statistics
Notes:
- Users should be aware that for presentational purposes the figure displays liabilities as a negative value, unlike the reference tables which display liabilities as a positive value
Download this image Figure 10.1: UK international investment position, assets, liabilities and balance, 2004 to 2013
.png (28.5 kB)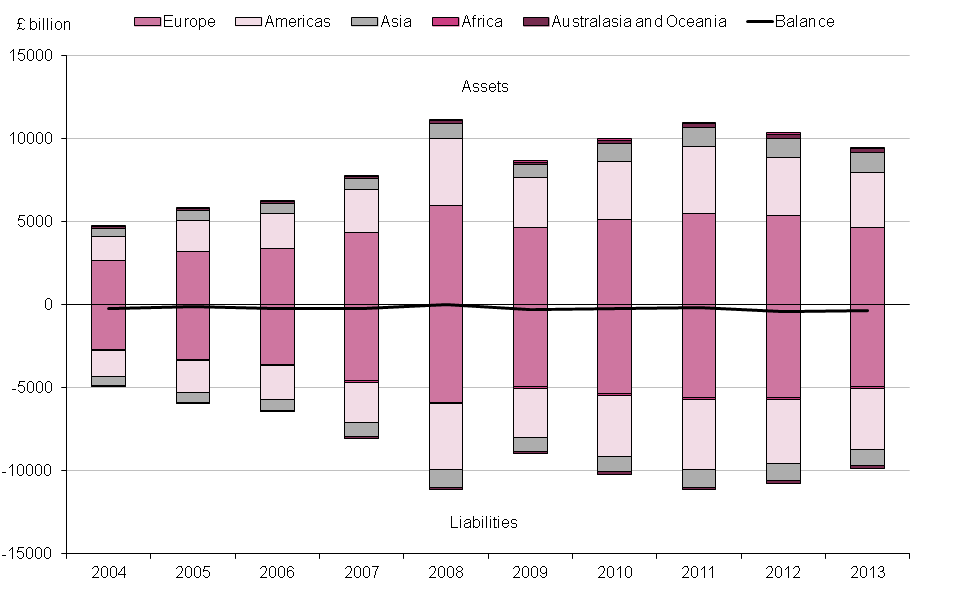
At the end of 2013, the UK’s IIP showed a net liability position of £244.0 billion, with reported assets totalling £9,684.3 billion and reported liabilities totalling £9,928.3 billion.
Figure 10.2: UK international investment position assets, 2004 to 2013
Source: Office for National Statistics
Download this chart Figure 10.2: UK international investment position assets, 2004 to 2013
Image .csv .xlsOf the total foreign assets held by UK residents at the end of 2013, there was:
£4,640.6 billion invested in Europe, which represented 48% of the UK’s total investment holdings abroad
£3,277.7 billion invested in the Americas, which represented 34% of the UK’s total investment holdings abroad – most of the investment in the Americas were held in the USA, which at £2,637.6 billion was a decrease of £215.2 billion on the previous year
£1,240.9 billion invested in Asia which represented 13% of the UK’s total investment holdings abroad – Japan, the UK’s main investment partner in this region, at £562.6 billion, represented 6% of total UK assets
£355.8 billion invested in Australasia and Oceania, Africa and International Organisations, which collectively represented 4% of the UK’s total investment holdings abroad
Figure 10.3: UK international investment position liabilities, 2004 to 2013
Source: Office for National Statistics
Download this chart Figure 10.3: UK international investment position liabilities, 2004 to 2013
Image .csv .xlsAt the end of 2013, of the total UK liabilities to the rest of the world, there was:
£4,975.5 billion invested by Europe, with the EU28 accounting for £4,061.9 billion of Europe’s total investment
£3,637.4 billion invested by the Americas, which represented 37% of the total UK liabilities – while the USA alone accounted for £3,173.4 billion, that is 32% of the total liabilities of the UK
£973.0 billion invested by Asia, which represented 10% of the total UK liabilities
£342.5 billion invested by Australasia and Oceania, Africa and International Organisations which collectively represented 3% of the total UK liabilities
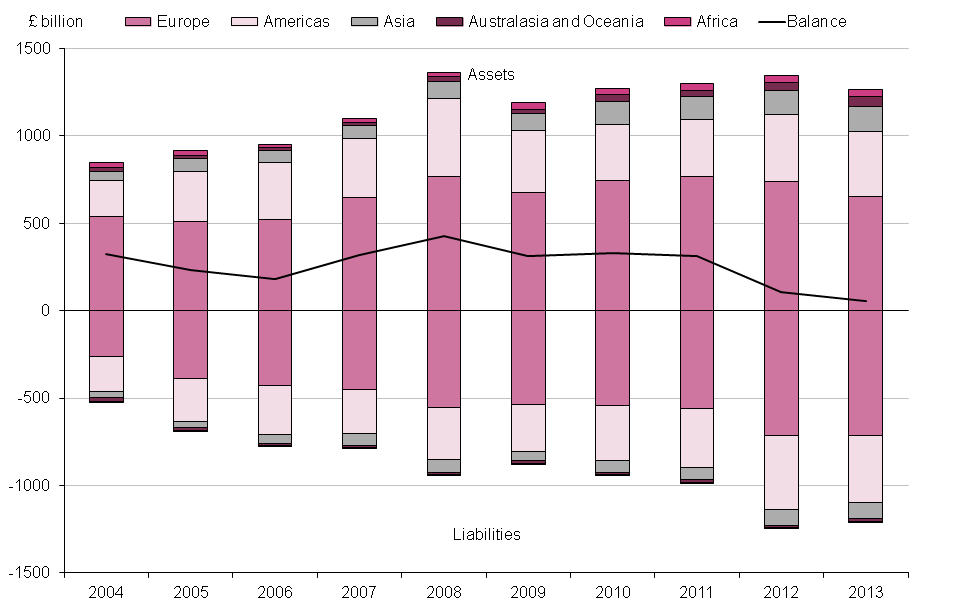
Figure 10.4: UK international investment position, direct investment position, 2004 to 2013
Source: Office for National Statistics
Download this image Figure 10.4: UK international investment position, direct investment position, 2004 to 2013
.png (33.4 kB)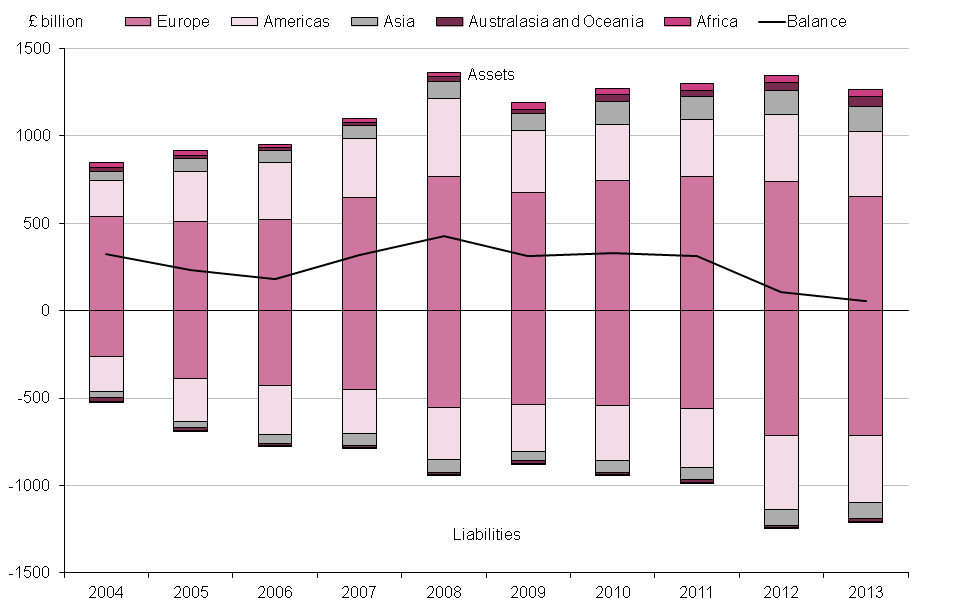
UK direct investment abroad at £1,267.5 billion contributed 13% to the stock of UK assets abroad at the end of 2013. Of total direct investment assets held by UK residents, there was:
£654.7 billion invested in Europe, which represented 52% of the UK’s total direct investment holdings abroad
£370.5 billion invested in the Americas, which represented 29% of the UK’s total direct investment holdings abroad, with most of the investment in the Americas being held in the USA at £270.5 billion
£142.3 billion invested in Asia, which represented 11% of the UK’s total direct investment holdings abroad
£57.0 billion invested in Australasia and Oceania, which represented 4% of the UK’s total direct investment holdings abroad
£43.0 billion invested in Africa, which represented 3% of the UK’s total direct investment holdings abroad
Direct investment in the UK equalled 12% of the total level of UK liabilities to the rest of the world in 2013 at £1,212.9 billion. Of total direct investment in the UK, there was:
£711.3 billion invested by Europe, with the EU28 accounting for £584.0 billion of Europe’s total direct investment
£386.0 billion invested by the Americas, which represented 32% of total UK liabilities – while the USA alone accounted for £309.1 billion, that is 25% of total direct investment into the UK
£91.4 billion invested by Asia, which represented 8% of total UK direct investment liabilities
£14.4 billion invested by Australasia and Oceania and £9.8 billion invested from Africa, which represented 1% each of total UK direct investment liabilities
Figure 10.5: UK international investment position, portfolio investment position, 2004 to 2013
Source: Office for National Statistics
Notes:
- Users should be aware that for presentational purposes the figure displays liabilities as a negative value, unlike the reference tables which display liabilities as a positive value
Download this image Figure 10.5: UK international investment position, portfolio investment position, 2004 to 2013
.png (32.8 kB)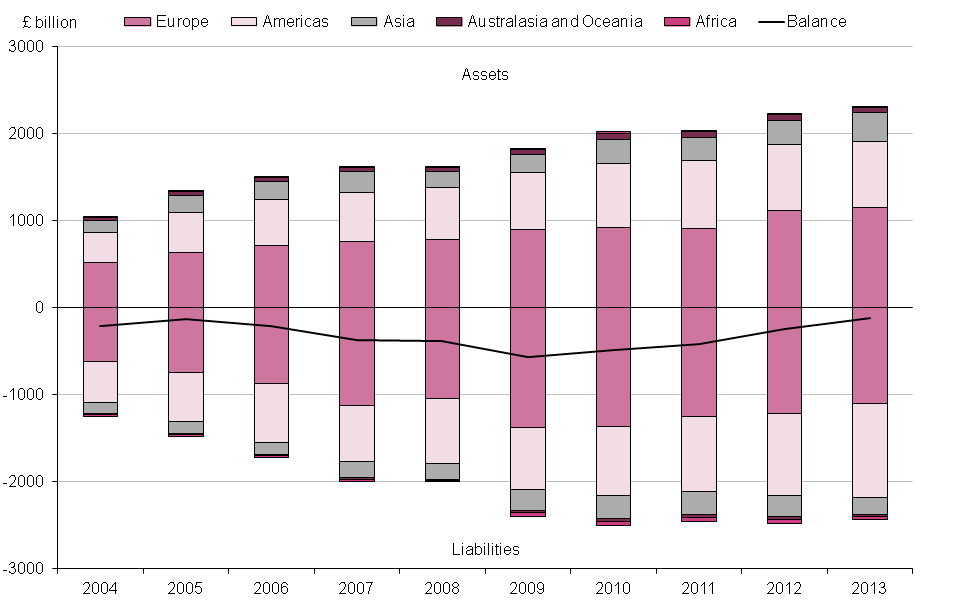
UK portfolio investment assets abroad at the end of 2013 stood at £2,443.6 billion, which represented 25% of total UK assets abroad. Of total portfolio investment assets held by UK residents, there was:
£1,154.0 billion invested in Europe, which represented 47% of the UK’s total portfolio investment holdings abroad
£761.6 billion invested in the Americas, which represented 31% of the UK’s total portfolio investment holdings abroad, with most of the investment in the Americas being held in the USA at £588.3 billion
£328.0 billion invested in Asia, which represented 13% of the UK’s total portfolio investment holdings abroad
£55.8 billion invested in Australasia and Oceania, which represented 2% of the UK’s total portfolio investment holdings abroad
£20.1 billion invested in International Organisations and £16.0 billion invested in Africa, which represented 1% each of the UK’s total portfolio investment holdings abroad
Portfolio investment liabilities are derived from the Co-ordinated Portfolio Investment Survey (CPIS) returns of other countries reporting assets held in the UK, and were £2,479.7 billion at the end of 2013. Of the UK’s total portfolio investment liabilities, there was:
£1,095.8 billion invested by Europe and £1,082.2 billion invested by the Americas, which represented 44% each of total UK portfolio investment liabilities
£193.4 billion invested by Asia, which represented 8% each of total UK portfolio investment liabilities
£47.9 billion invested by International Organisations, which represented 2% each of total UK portfolio investment liabilities
£31.2 billion invested by Africa and £29.2 billion invested from Australasia and Oceania, which represented 1% each of total UK portfolio investment liabilities
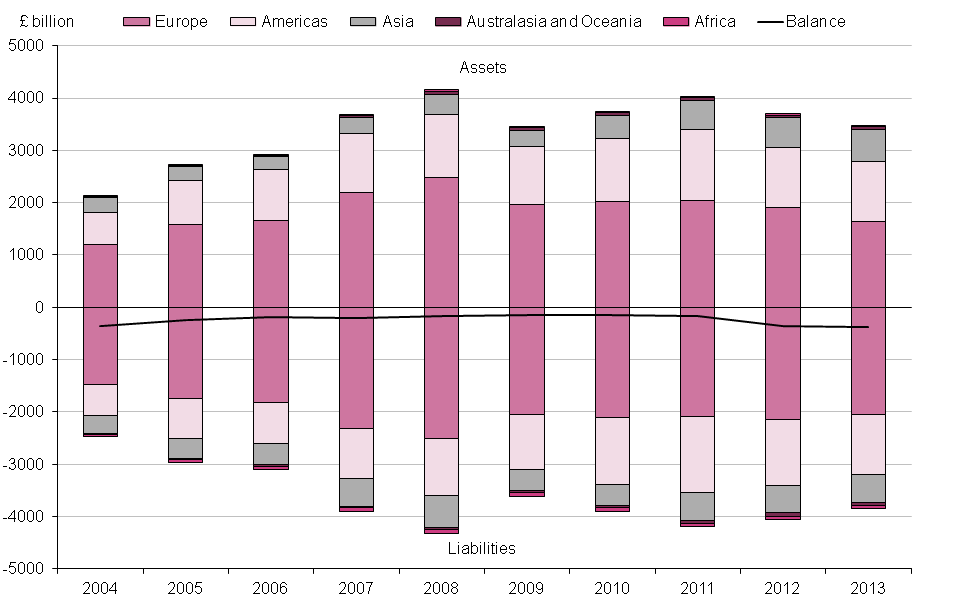
Figure 10.6: UK international investment position, other investment position, 2004 to 2013
Source: Office for National Statistics
Notes:
- Users should be aware that for presentational purposes the figure displays liabilities as a negative value, unlike the reference tables which display liabilities as a positive value
Download this image Figure 10.6: UK international investment position, other investment position, 2004 to 2013
.png (31.1 kB)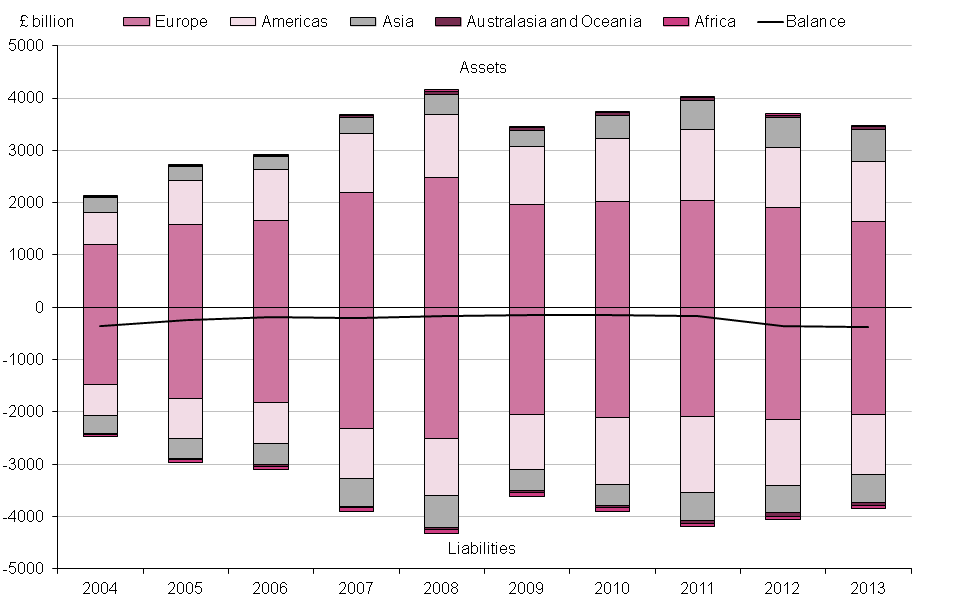
The UK’s other investment assets abroad totalled £3,487.5 billion at the end of 2013, which was 36% of total UK assets. Of total other investment assets held by UK residents, there was:
£1,646.0 billion invested in Europe, which represented 47% of the UK’s total other investment holdings abroad
£1,146.2 billion invested in the Americas, which represented 33% of the UK’s total other investment holdings abroad, with most of the investment in the Americas being held in the USA at £884.6 billion
£600.7 billion invested in Asia, which represented 17% of the UK’s total other investment holdings abroad
£55.7 billion invested in Australasia and Oceania, which represented 2% of the UK’s total other investment holdings abroad
£32.9 billion invested in Africa, which represented 1% of the UK’s total other investment holdings abroad
UK other investment liabilities totalled £3,859.0 billion at the end of 2013, which was 39% of total UK liabilities. Of the UK’s total other investment liabilities, there was:
£2,050.0 billion invested by Europe, which represented 53% of total UK other investment liabilities
£1,137.1 billion invested by Americas, which represented 29% of total UK other investment liabilities – while the USA alone accounted for £905.0 billion, that is 23% of total other investment into the UK
£538.2 billion invested by Asia, which represented 14% of total UK other investment liabilities
£68.6 billion invested by Africa, which represented 2% of total UK other investment liabilities
£57.5 billion invested by Australasia and Oceania, which represented 1% of total UK other investment liabilities