1. Main points
In Quarter 4 (October to December) 2015, gross domestic product (GDP) per head increased 0.4% compared with Quarter 3 (July to September) 2015 and is now 0.9% above pre-economic downturn levels. This was a slightly slower growth rate than the 0.6% quarterly increase seen in GDP.
Net national disposable income (NNDI) per head grew by 1.7% in quarter 4 2015 compared with the same quarter a year ago. This was slightly faster than growth of 1.3% in GDP per head over the same period.
In Quarter 4 2015, real household disposable income (RHDI) per head (excluding non-profit institutions serving households) decreased 0.4% compared with Quarter 3 2015. However, it was 1.5% higher when compared with the same quarter a year ago (Quarter 4 2014). Overall, it remains broadly in line with the level of household income seen in mid-2012.
Although RHDI per head decreased, in Quarter 4 2015, household spending per head grew 0.4% compared with the previous quarter – continuing the general upward trend seen since Quarter 3 (July to September) 2011.
In the period July 2012 to June 2014, the households within the top income quintile owned 63.1% of all financial wealth, more than the financial wealth of all other income quintiles combined.
In 2014, the net worth of the economy as a whole increased 5.0% to £8.1 trillion. In the same year, household net worth increased 12.2% (by £1.0 trillion) to £9.4 trillion, the largest year-on-year percentage change since 1998. The total net worth of households is larger the whole economy due to negative contributions from financial and non-financial corporations and Government.
Nôl i'r tabl cynnwys2. Introduction
This release considers the measurement of economic or material well-being, presenting a number of indicators alongside commentary that, together, give a more rounded and comprehensive basis for assessing changes in economic well-being. More detail can be found in the Economic Well-being, Framework and Indicators article. Economic well-being is a subset of the measurement of national well-being and recognises that many dimensions of well-being are outside the material sphere (for example, our “Wheel of Well-being”).
Nôl i'r tabl cynnwys3. Whole economy production and income
Figure 1 : Gross Domestic Product (GDP) per head, Q1 2008 to Q4 2015
UK
Source: Office for National Statistics
Notes:
- Q1 refers to Quarter 1 (January to March), Q2 refers to Quarter 2 (April to June), Q3 refers to Quarter 3 (July to September) and Q4 refers to Quarter 4 (October to December).
Download this chart Figure 1 : Gross Domestic Product (GDP) per head, Q1 2008 to Q4 2015
Image .csv .xlsReal GDP per head
In Q4 2015, gross domestic product (GDP) per head, which adjusts GDP for the size of the population, increased 0.4% compared with Q3 2015. This was a slightly slower growth rate than the 0.6% quarterly increase seen in GDP, which recovered to its pre-economic downturn level in Q2 2013. The quarterly growth in GDP per head means that it is now 0.9% above its pre-economic downturn level, having initially surpassed its pre-economic downturn level in Q2 2015.
Between 2014 and 2015, GDP per head increased 1.5%. This was slower than the 2.3% increase in GDP over the same period.
Real net national disposable income (NNDI) per head
In Q4 2015, NNDI per head increased 1.7% compared with the same quarter a year ago (Q4 2014). This is compared to a 1.3% increase GDP per head in Q4 2015 compared with the same quarter a year ago.
Between 2014 and 2015, NNDI per head increased 2.4%. This was faster than the 1.5% increase in GDP per head over the same period.
As discussed in the Economic Well-being, Framework and Indicators article, there are 2 main differences between GDP per head and NNDI per head. First, not all income generated by production in the UK will be payable to UK residents. Some of the capital employed will be owned by non-residents and they will be entitled to the return on that investment. Conversely, UK residents receive income from production activities taking place elsewhere, based on their investments overseas. Adjusting for these flows gives a measure that is more focused on income rather than production.
Second, these measures can be adjusted for capital consumption. GDP is “gross” in the sense that it does not adjust for capital depreciation, that is, the day-to-day wear and tear on vehicles, machinery, buildings and other fixed capital used in the productive process. It treats such consumption of capital as no different from any other form of consumption. But most people would not regard depreciation as adding to their material well-being.
GDP per head and net domestic product (NDP) per head, which just makes the adjustment for capital depreciation, track reasonably well over the course of the recession, suggesting that the impact of capital consumption is relatively low.
However, NNDI has behaved somewhat differently to GDP, particularly since late 2011. NNDI per head, which represents the income generated by production that is payable to UK residents, grew by 3.3% between Q1 2012 and Q4 2015. This is compared to GDP per head which has grown by 5.9% over the same period. This means that in Q4 2015 NNDI per head was 3.0% below its pre-economic downturn level. However, GDP per head was 0.9% above its pre-economic downturn level.
The difference between the experience of GDP per head and NNDI per head since late 2011 can be explained by looking at the balance of primary incomes, which captures flows of income into and out of the UK economy.
One main part of primary incomes is direct investment; that is, earnings from cross-border investments made by residents and businesses from one country into another, with the aim of a establishing a lasting relationship. Ownership of at least 10% of the voting power, representing the influence by the investor, is the basic criterion used.
Looking at the longer run trend, UK FDI earnings have traditionally made a positive contribution to the UK current account since 1997, partly offsetting negative contributions from the other major components. However, the positive contribution of FDI earnings has fallen since 2011, turning negative in 2015. More information is available in our analysis of the drivers behind the fall in direct investment earnings and their impact on the UK's current account deficit release.
Looking in more detail at recent periods, since late 2011, there has been a fall in the balance of earnings on foreign direct investment (FDI) (the difference between earnings from direct investment abroad and from foreign direct investment in the UK). The continued fall resulted in a direct investment deficit between Q3 2014 and Q1 2015, the first such deficit since Q4 2008. This deterioration is attributed to both subdued earnings for UK residents’ from direct investment abroad and an increase in foreign earnings on direct investment in the UK. The balance of earnings on foreign direct investment rebounded slightly, returning to a surplus in Q2 2015 but once again fell in Q3 2015. In Q4 2015, the balance of earnings on direct investment decreased to negative £5.0 billion (from £0.5 billion in Q3 2015), reflecting both an increase in foreign earnings on direct investment in the UK (£2.5 billion) and a decrease in the amount the UK earns from its direct investment abroad (negative £3.0 billion).
Perception of the economic situation
The Eurobarometer Consumer survey asks respondents how they think the general economic situation has changed over the last 12 months. In December 2015, the aggregate balance stood at negative 1.8. The small negative balance suggests that on average, respondents think the economic situation has got slightly worse compared with a year ago, although in general it is broadly similar. This is an increase on the negative 4.5 aggregate balance recorded at the end of the third quarter of 2015 (September 2015). The series has been on a general upwards trend in recent years until April 2015, when the trend turned slightly negative. At its lowest, in May 2009, the Eurobarometer reported an aggregate balance of negative 82.3.
Nôl i'r tabl cynnwys4. Household income
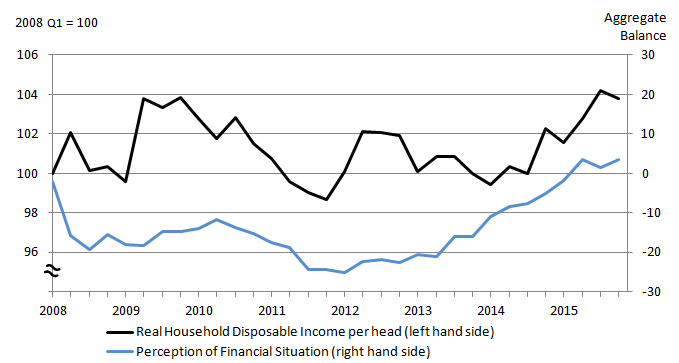
Figure 2 : Real household disposable income (RHDI) per head and perception of financial situation, Q1 2008 to Q4 2015
UK
Source: Office for National Statistics and GfK (for the Eurobarometer Consumer Survey)
Notes:
- Household's perception of their own financial situation over the last 12 months - last month of each quarter used.
- Households do not include non profit institutions serving households (NPISH).
- Q1 refers to Quarter 1 (January to March), Q2 refers to Quarter 2 (April to June), Q3 refers to Quarter 3 (July to September) and Q4 refers to Quarter 4 (October to December).
- The Eurobarometer Consumer Survey is collected by GfK for the European Commission.
Download this image Figure 2 : Real household disposable income (RHDI) per head and perception of financial situation, Q1 2008 to Q4 2015
.png (16.9 kB) .xls (32.3 kB)
In Q4 2015, real household disposable income (RHDI) per head (excluding non-profit institutions serving households) increased 1.5% compared with the same quarter a year ago (Q4 2014). In Q4 2015, RHDI per head (excluding NPISH) decreased 0.4% compared with Q3 2015. For 2015 as a whole, RHDI per head (excluding NPISH) increased 2.6% compared with 2014.
Overall, in Q4 2015, RHDI per head (excluding NPISH) was 3.8% above its pre-economic downturn level.
In previous releases, we considered RHDI per head of the household and non-profit institutions serving households (NPISH) sector. In March 2015, we published initial estimates of the real disposable income of households only. We consider this a better indicator of the economic well-being of households. Real household and NPISH disposable income per head will continue to be published alongside RHDI per head (excluding NPISH) in this release.
Real household and NPISH disposable income per head increased 1.5% in Q4 2015 compared with the same quarter a year ago (Q4 2014). For 2015 as a whole, real household and NPISH disposable income per head increased 2.5% compared with 2014.
As GDP began to fall in mid-2008, RHDI (excluding NPISH) per head remained relatively resilient. By Q2 2009, RHDI (excluding NPISH) per head was 3.8% above its pre-economic downturn level. This initial improvement in real household income per head was a result of several factors.
Firstly, interest rates reached historic lows and therefore household incomes were helped by falling mortgage payments.
Additionally, as employment fell and unemployment rose, people paid less income tax and claimed more benefits, supporting RHDI per head (excluding NPISH). However, moving into early 2011, the impact of these factors wore off and inflation rose. Prices grew more strongly than household income and therefore, over time, people found that their income purchased a lower quantity of goods and services.
Following this, RHDI per head (excluding NPISH) began to rise in early 2012 before stabilising toward the end of 2012 and falling to its pre-economic downturn level in Q4 2013. Over the last few quarters, however, RHDI per head (excluding NPISH) has shown positive growth. In Q4 2015, RHDI per head (excluding NPISH) increased 1.5% compared with the same quarter a year ago and was 3.8% above its pre-economic downturn levels.
For international comparisons it is important to consider benefits in kind. The real household and NPISH adjusted disposable income per head series, which makes the adjustment for benefits in kind, can be found in the reference table.
Perception of financial situation
As well as considering levels of household income, it is important to consider individuals' perceptions of their own income. The Eurobarometer Consumer Survey asks respondents their views on the financial situation of their household over the past 12 months. A negative balance means that, on average, respondents reported their financial situation got worse, a positive balance means they reported it improved and a zero balance indicates no change.
Between the end of Q3 2015 and the end of Q4 2015, the aggregate balance increased from 1.4 to 3.5, continuing the positive balances that have been seen in recent months following sharp increases since early 2013.The figure suggests that, on average, households are beginning to feel their financial situation has improved over the past 12 months.
The Eurobarometer Consumer survey also asks respondents their views on whether now is a good time to save. The balance had been negative from April 2011 onwards, but following improvements from May 2013, the series reached a positive figure in June 2015. Between the end of Q3 2015 and the end of Q4 2015, the balance fell from 4.4 to 1.7. This slightly positive figure suggests that respondents believe now is a good time to save, although it is near the zero no change figure. Also, on average, households reported saving at least some of their income.
Additionally, Understanding Society provides information on the proportion of individuals that report being somewhat, mostly, or completely, satisfied with the income of their household and the proportion of households that report finding it quite, or very, difficult to get by financially.
In the financial year ending 2014, the proportion of individuals that reported finding it difficult to get by financially was 9.1%. This was 1.0 percentage point lower than a year earlier, continuing the downward trend since it peaked at 12.3% in the financial year ending 2010. Despite falling in recent years, the proportion of individuals that report finding it difficult to get by financially remains above pre-economic downturn levels.
In the financial year ending 2014, the percentage of respondents that were somewhat, mostly, or completely, satisfied with their level of income was 53.7%. This is broadly unchanged from a year earlier. Satisfaction with income demonstrated a downward trend between 2007 and the financial year ending 2012, recording a 4.5 percentage point decline between the financial years ending 2011 and 2012. While the increase in the financial year ending 2013 and 2014 shows some improvement in this trend, it remains below the levels seen prior to the economic downturn.
Distribution of income
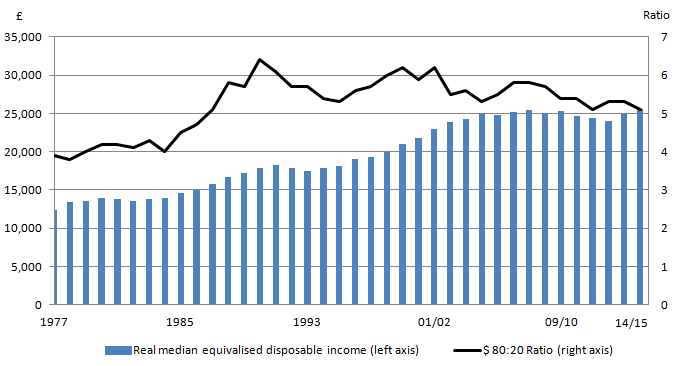
Figure 3: Real median household income and income inequality (1997 to financial year ending 2015)
UK
Source: Office for National Statistics
Notes:
- A household's disposable income is made up of all its earnings and investment income (including private pensions), plus cash benefits received from the state, minus direct taxes such as Income Tax and Council Tax. Equivalisation adjusts the income of households to reflect the different costs associated with different sizes and compositions of households.
- This is the ratio of the total equivalised disposable income of the richest fifth of the population to that of the poorest fifth of the population.
- Years are calendar years until 1993 and financial years from 1994/95.
- Income is deflated using the Household final consumption expenditure implied deflator.
Download this image Figure 3: Real median household income and income inequality (1997 to financial year ending 2015)
.png (31.2 kB) .xls (32.3 kB)
In the financial year ending 2015, median income (the income of the middle household if all households are ranked from the lowest income to the highest) was £25,700, which is 3.3% higher than financial year ending 2014. This continues the growth in median income since the financial year ending 2013, reaching a similar level to that recorded in financial year ending 2008 - its pre-economic downturn level.
Median household income represents the middle of the income distribution and provides a good indication of the “typical” household. However, it is also important to consider how income is distributed around the middle, considering the equality of the income distribution.
One indicator is the ratio of total income received by the richest fifth of households to that received by the poorest fifth (other indicators are available). If the ratio gets larger then it implies increasing inequality between the top fifth and bottom fifth of households.
Between the financial years ending 2014 and 2015, this ratio remained at 5.3; suggesting no change in income inequality. The stability in the ratio was the result of the mean income of the richest fifth rising at a similar rate to that of the mean income of the poorest fifth, rising 3.6% and 3.8% respectively. However, since the turn of the millennium, changes in income inequality have been relatively small compared with previous decades.
Notes for household income
The Eurobarometer Consumer Survey is collected by GfK for the European Commission. There is more information about interpreting the Eurobarometer Consumer Survey in background note 5.
Understanding Society is a household longitudinal study that captures information from a representative UK sample. More information can be found in background note 6.
Real household disposable income (RHDI) is published in both non-seasonally adjusted (NSA) and seasonally adjusted (SA) formats in the United Kingdom Economic Accounts, with the latter removing seasonal effects to allow comparisons over time. However, it is sensitive to short-term changes in its components, particularly on a quarterly basis, meaning that quarter-on-quarter movements can appear volatile. To present the longer-term movement in household income better, this bulletin presents RHDI growth on a quarter on the same quarter a year ago and on an annual basis.
The income measure used in this section is real equivalised household disposable income. Disposable income is the amount of money that households have available for spending and saving after direct taxes (such as income tax and council tax) have been accounted for. It includes earnings from employment, private pensions and investments, as well as cash benefits provided by the state. Equivalisation is the process of accounting for the fact that households with many members are likely to need a higher income to achieve the same standard of living as households with fewer members.
Throughout this release Q1 refers to Quarter 1 (January to March), Q2 refers to Quarter 2 (April to June), Q3 refers to Quarter 3 (July to September) and Q4 refers to Quarter 4 (October to December).
5. Household spending
Income is a viable measure of the material well-being in the economy, however, a fuller picture of the economic well-being of a country can be found by looking at how much households consume.
In June 2014, we published [Income, Expenditure and Personal Well-being, 2011/12][3], which presented new findings on the relationship between personal well-being, household income and expenditure using regression analysis. It found that household expenditure appeared to have a stronger relationship with personal well-being than household income.
Figure 4 : Household final consumption expenditure (HHFCE) per head, Q1 2008 to Q4 2015
UK
Source: Office for National Statistics
Notes:
1.Households include non profit institutions serving households (NPISH). 2. Throughout this release Q1 refers to Quarter 1 (January to March), Q2 refers to Quarter 2 (April to June), Q3 refers to Quarter 3 (July to September) and Q4 refers to Quarter 4 (October to December).
Download this chart Figure 4 : Household final consumption expenditure (HHFCE) per head, Q1 2008 to Q4 2015
Image .csv .xlsIn Q4 2015, real household spending per head grew 0.4% compared with the previous quarter, continuing the general upward trend seen since Q3 2011. However, real household spending per head remains 0.8% below its pre-economic downturn level. This is despite the fact that real household income per head (excluding NPISH) was 3.8% above its pre-economic downturn level in Q4 2015.
Since Q3 2011, real household spending per head has steadily increased. This could reflect improved economic sentiment among households. In 2015 overall, real household spending per head was 1.9% higher than 2014. The pace of growth between 2014 and 2015 was faster than the 1.7% growth seen between 2013 and 2014.
As with household income, for international comparisons it is important to consider benefits in kind. Real household and NPISH actual final consumption per head, which makes the adjustment for benefits in kind, can be found in the reference table.
Nôl i'r tabl cynnwys6. Wealth
This section considers 2 different measures of wealth; net worth from the national accounts and household wealth from the Wealth and Assets Survey (WAS).
Total net worth
In 2014, the net worth of the economy as a whole (of households, businesses and the government) increased by £385 billion (5.0%), to £8.1 trillion. Total net worth is the sum of the values of financial assets (for example, shares and deposits) and non-financial assets (for example, dwellings and machinery), minus financial liabilities. Growth in total net worth between 2013 and 2014 was mainly attributable to an increase in the net worth of households, which increased by £1.0 trillion (12.2%) to £9.4 trillion.
This was partly offset by decreases in the net worth of financial corporation’s (-£364 billion), non-financial corporation’s (-£54 billion) and government (-£227 billion). More information on this is available in the 2015 National Balance Sheet publication.
This measure has not been adjusted for inflation, which was 1.5% on average, as measured by the Consumer Price Index (CPI) between 2013 and 2014. This suggests that the growth in total net worth was stronger than the growth in the general price level between 2013 and 2014.
The net worth of the economy as a whole is important as it indicates the sustainability of current levels of production and corresponding income flows. It is possible that a nation might be increasing its output while its stock of assets decline. This could mean that its level of production is unsustainable. However, for a complete appraisal of sustainability, natural, human and social capital should also be considered1.
Figure 5 shows total net worth between 2004 and 2014 for the whole economy and 3 of the sectors: households, financial and non-financial corporations. Between 2004 and 2007, total net worth increased year-on-year, mainly attributable to an increase in household net worth. Total net worth then fell in 2008 and 2009, before increasing again following the economic downturn.
Figure 5 : Net financial and non-financial capital, (2004 to 2014)
UK
Source: Office for National Statistics
Notes:
- Here “net” is used to describe the net wealth position (assets minus liabilities), rather than making an adjustment for the consumption of fixed capital.
- Components may not sum to total due to rounding.
- NPISH - non-profit institutions serving households.
Download this chart Figure 5 : Net financial and non-financial capital, (2004 to 2014)
Image .csv .xlsHousehold net worth
Household net worth increased by £1.0 trillion (12.2%) to £9.4 trillion between 2013 and 2014. This is the largest year-on-year percentage change since 1998, when household net worth grew by 13.8%.
Household net worth provided the largest contribution to the growth in whole economy total net worth in 2014. This is equivalent to an average of £354,000 per household, compared with £316,000 per household in 2013.
As with total net worth, household net worth has not been adjusted for inflation. As a result, these figures should be taken in some context. For instance, household net worth includes non-financial assets, such as houses. Annual house price inflation was 10.0%2 in 2014. Figure 6 shows the household net worth position by type of asset between 2004 and 2014.
Figure 6 : UK household and non-profit institutions serving households net wealth by asset type, 2004 to 2014
UK
Source: Office for National Statistics
Notes:
- Other non-financial assets show all non-financial assets except for dwellings.
Download this chart Figure 6 : UK household and non-profit institutions serving households net wealth by asset type, 2004 to 2014
Image .csv .xlsThe main contributing asset category to the 12.2% increase in household net worth between 2013 and 2014 was net financial assets, which increased 17.3%. Dwellings, the most valuable asset in household net worth (£4.8 trillion; 51% of household net worth in 2014), increased 9.1% over the same period. "Other non-financial" assets also grew 1.8% between 2013 and 2014 – a slower rate than increases seen in other asset categories.
Distribution of Household Wealth
In December 2015, the main results from the Wealth and Assets Survey (WAS) for the period July 2012 to June 2014 were published. Estimates from WAS are updated every 2 years, therefore different measures demonstrating the distribution of wealth will be presented at this point in each quarterly bulletin.
Household wealth comprises 4 components: property, financial, physical and private pension wealth.
Table 1 presents the value of total household wealth, broken down by component, for equivalised income quintiles (the population divided into 5 equal groups by equivilised income) for July 2012 to June 2014. It shows that households in the top income quintile (the top 20% of the income distribution) own £5,220 billion of wealth – the largest of all the income quintiles. Looking at the components in more detail, those in the highest income quintile own 63.1% of all financial wealth - more than all the other income quintiles, 1 to 4, together. Similarly, households in the highest income quintile own almost half (49.6%) of pension wealth.
Both property and physical wealth are more evenly distributed. The richest fifth of households, in terms of income, accounted for 41.5% of all property wealth, and 32.1% of all physical wealth.
Table 1: Aggregate wealth by wealth component and income quintile (£ billions), July 2012 to June 2014
| UK | |||||||
| Quintile 1 | Quintile 2 | Quintile 3 | Quintile 4 | Quintile 5 | |||
| Property | 379 | 446 | 614 | 860 | 1630 | ||
| Financial | 71 | 110 | 159 | 249 | 1007 | ||
| Physical | 137 | 169 | 218 | 259 | 369 | ||
| Pension | 159 | 320 | 625 | 1142 | 2214 | ||
| Total | 746 | 1045 | 1616 | 2510 | 5220 | ||
| Source: Office for National Statistics | |||||||
Download this table Table 1: Aggregate wealth by wealth component and income quintile (£ billions), July 2012 to June 2014
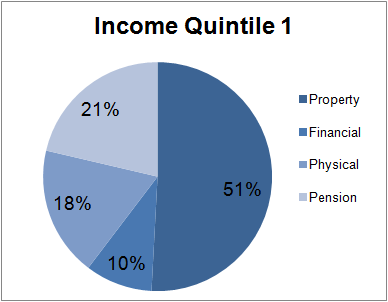
.xls (26.6 kB)Figures 7.1 and 7.2 highlight the composition of total wealth for both income quintile 1 (those in the bottom 20% of the income distribution) and income quintile 5 (those in the top 20% of the income distribution). Pension wealth is the largest component of wealth for the fifth income quintile, accounting for 42.4% of total wealth. However, pension wealth only accounts for 21.3% of the first income quintile’s total wealth, and is the component which has the greatest difference between the first and fifth quintile, in terms of the proportion of total wealth.
The component with the second largest difference between the first and fifth quintile is property wealth. The first income quintile own £379.3 billion of property wealth - more than half (50.8%) of the first income quintile’s total wealth. The fifth income quintile, on the other hand, owns more property wealth (£1629.8 billion), but this only amounts to 31.2% of their total wealth. Finally, physical property has the smallest proportion of the fifth income quintile’s total wealth portfolio, accounting for 7.1%. The smallest proportion of the lowest income quintile’s wealth is financial wealth, accounting for 9.5%.
Figure 7.1: Distribution of total household wealth for the lowest income quintile, July 2012 to June 2014
UK
Source: Office for National Statistics
Download this image Figure 7.1: Distribution of total household wealth for the lowest income quintile, July 2012 to June 2014
.png (9.3 kB)
Figure 7.2: Distribution of total household wealth for the highest income quintile, July 2012 to June 2014
UK

Source: Office for National Statistics
Download this image Figure 7.2: Distribution of total household wealth for the highest income quintile, July 2012 to June 2014
.png (9.3 kB)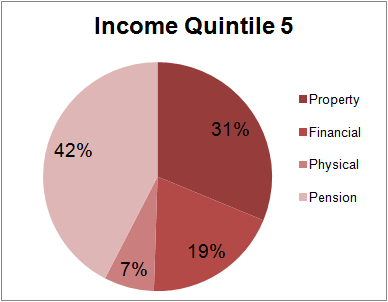
Notes for Distribution of wealth
Figure 7.2 sums to 99%, this is due to rounding.
Property wealth comprises the value of the main residence for a household and the value of any additional property or properties owned by any adults within the household.
Physical wealth is derived from respondents’ own estimates of the value of the contents of their main residence, the contents of any property which the household owns other than the main residence and also collectables, valuables, vehicles and personalised number plates.
Financial wealth comprises: formal financial assets (such as bank accounts, savings accounts, stocks and shares); informal financial assets (such as money saved at home); assets held by children in the household; and liabilities (such as formal borrowing, overdrafts and arrears on household bills).
Pension wealth relates to private pension wealth only, which means state pension wealth is excluded from the analysis.
7. Unemployment
Figure 8 : Unemployment, (Q1 2008 to Q4 2015)
UK
Source: Office for National Statistics
Notes:
- All aged 16 and over.
- Seasonally adjusted.
- Q1 refers to Quarter 1 (January to March), Q2 refers to Quarter 2 (April to June), Q3 refers to Quarter 3 (July to September) and Q4 refers to Quarter 4 (October to December).
Download this chart Figure 8 : Unemployment, (Q1 2008 to Q4 2015)
Image .csv .xlsIn the 3 months to December 2015 (Q4 2015), the unemployment rate was 5.1%, down 0.2 percentage points from the 3 months to September 2015 (Q3 2015). This continues the downward trend since a peak in the unemployment rate of 8.4% in Q4 2011. The unemployment rate is now 0.1 percentage points below its pre-economic downturn rate of 5.2%, recorded in Q1 2008.
The unemployment rate fell sharply between Q2 2013 and Q1 2015 at an average of 0.3 percentage points per quarter. It then stabilised in Q2 2015 before falling once again in Q3 2015 and Q4 2015.
On an annual basis, the unemployment rate in 2015 was 5.4% - down 0.8 percentage points from 6.2% in 2014. This continues the downward trend seen since 2011, when the unemployment rate had reached 8.1% following increases from 2008 onwards.
Moving from employment to unemployment can impact on economic well-being through individuals’ income, and may directly impact on their personal well-being (ratings of life satisfaction, sense that things they do in life are worthwhile, happiness and anxiety). However, our Labour Market Flows release shows that many of those who are unemployed were previously inactive (for example, through looking after family or being ill) and are now searching for a job. This could be seen as a positive step towards employment. The latest personal well-being information is available in our Measuring National Well-being: Personal Well-being in the UK, 2014 to 2015 release.
The employment rate for those aged 16 to 64 increased to 74.1% in the 3 months to December - the highest on record. This is up from 73.2% in the same quarter a year ago. In addition, average weekly hours worked rebounded strongly in the 3 months to December 2015 after it had a low Q3; mainly owing to workers, on average, taking more leave than a year ago.
The recent strength of the labour market is also reflected in the degree of mobility within the labour force. The rate of job-to-job moves, defined as the proportion of employees who change employer between one quarter and the next, fell from around 2.5% of employees to around 1.7% during 2008 and 2009, as the economic outlook became more uncertain and workers became less confident about moving from one post to another. However, since the start of the economic recovery, and in particular since 2012, job-to-job moves have recovered – reaching its highest level since Q1 2008 in the three months to September 2015 (2.5% of employees). In the 3 months to December 2015 this figure had fallen slightly to around 2.2% of employees – still among the highest levels since the economic downturn began – led by a growing number of moves initiated by resignations.
Notes for unemployment
Throughout this release Q1 refers to Quarter 1 (January to March), Q2 refers to Quarter 2 (April to June), Q3 refers to Quarter 3 (July to September) and Q4 refers to Quarter 4 (October to December).
The rate of job-to-job moves is calculated using a 4-quarter moving average. The series can be found in the March Economic Review.
8. Inflation
Figure 9 : Consumer Price Index (CPI) inflation, Jan 2008 to Feb 2016
UK
Source: Office for National Statistics
Download this chart Figure 9 : Consumer Price Index (CPI) inflation, Jan 2008 to Feb 2016
Image .csv .xlsIn the year to December 2015 (the final month of Q4 2015) the rate of inflation, as measured by the Consumer Prices Index (CPI), was 0.2%. Despite being at its highest rate since January 2015, when it was 0.1 percentage points higher at 0.3%, the CPI-12 month rate remains close to zero. This has been the trend since early 2015 and means that, on average, consumers have experienced very little change in prices compared with the same period in 2014. In the year to December 2015 the rate of inflation was up 0.1 percentage points from the 0.1% recorded in the year to November 2015, and up 0.2 percentage points from the 0.2% rate recorded in the year to October 2015.
Looking across the year overall, prices for transport costs, food and non-alcoholic beverages and (to a lesser extent) recreational and cultural goods and services have had a downward pull on the rate of inflation. These have been counterbalanced by an upward pull from price movements for other goods and services, most notably restaurant and hotel bills, and education costs such as university tuition fees.
Since Q4 2015, the rate of inflation has increased but remains weak in the historical context. In the year to February 2016 (the latest data point available), the CPI was 0.3%. This was 0.1 percentage points higher than the 0.2% recorded in the year to December 2015.
The rate of inflation is important for economic well-being due to its effect on both income and savings. When prices increase faster than income for a sustained period, all else equal, incomes have less purchasing power and households feel worse off. Equally, if incomes increase faster than prices, over time, incomes can buy more and households feel better off. The income section of this release considers the evolution of household income, adjusted for inflation. In addition, inflation can impact on households through its effect on savings. If inflation is lower than the interest rates offered to households by financial institutions, then the real value of savings increases. Similarly, if inflation is higher than these interest rates then the real value of savings decreases.
Perceptions of inflation
It is important to consider not only inflation itself, but also individuals' perceptions of price trends. The Eurobarometer Consumer Survey asked respondents how they thought consumer prices had developed over the past 12 months. Individual’s perceptions of price changes have mapped reasonably well to actual changes in price levels until May 2015 where individual perceptions of price changes have been slightly negative since. This differed to actual changes which were close to zero over the same period.
There has been a general downward trend since mid-2011 with the aggregate balance falling to negative 10.6 in December 2015 (the last month of Q4), down from negative 7.9 in September 2015 (the last month of Q3). This compares with an aggregate balance of negative 7.5 in November 2015 and negative 8.6 in October 2015. An aggregate balance near zero implies that, on average, people perceive prices to be similar to that of a year ago whereas a negative figure means people perceive prices to have fallen over the last 12 months.
Notes for inflation
- Throughout this release Q1 refers to Quarter 1 (January to March), Q2 refers to Quarter 2 (April to June), Q3 refers to Quarter 3 (July to September) and Q4 refers to Quarter 4 (October to December).