1. Main points
The UK spent £483 billion on social protection in 2013, equivalent to 28% of GDP
In the UK in 2013, nearly three quarters of social protection expenditure was on old age and sickness
Between 2008 and 2013, the number of male old age beneficiaries rose 16.0% while the number of female old age beneficiaries fell by 0.2% in the UK
In 2013, expenditure on disability social protection in the UK fell in real terms by £392 per recipient
In 2013, the UK maintained its position among the selected countries as the highest spender on housing social protection (£394 per capita)
2. International comparisons
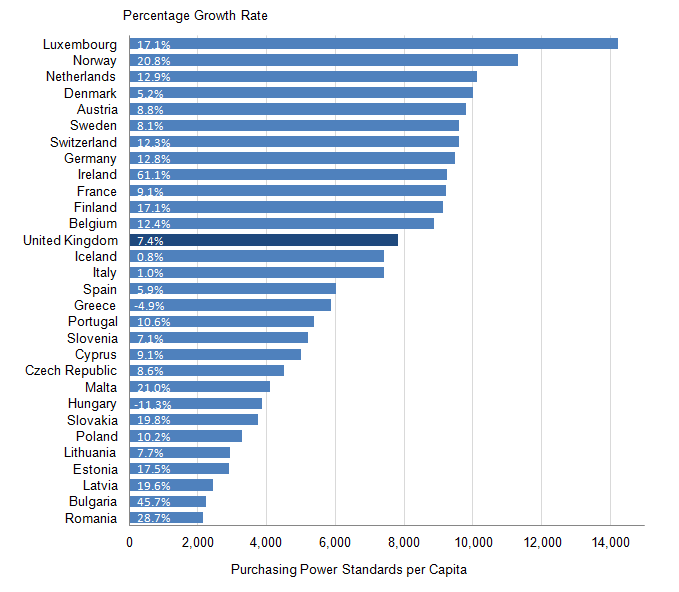
Figure 1 compares social protection expenditure per capita in 2013 internationally1. Expenditure is measured in purchasing power standards (PPS). This is an artificial currency unit used for international comparisons. One PPS will, in theory, buy exactly the same amount in each country at a common point in time.
Where data availability permits, the percentage growth in social protection provision since 2007 is also given. To aid meaningful comparison, the effects of price change are excluded from these percentages.
Figure 1: International Comparisons of Social Protection Expenditure per Capita in 2013, and Growth from 2007 to 2013
UK
Source: Eurostat
Notes:
- Data for 2013 were not available for Denmark, Ireland, Greece, Netherlands, Poland, Romania, and Iceland. For these seven countries, 2012 estimates of PPS expenditure have been used.
- Turkey, Croatia and Serbia are not included for reasons of data availability.
Download this image Figure 1: International Comparisons of Social Protection Expenditure per Capita in 2013, and Growth from 2007 to 2013
.png (30.9 kB) .xls (28.7 kB)
The average growth in national expenditure per capita in this period was 13.4%2. Hungary and Greece were the only countries who reported a decline in the level of real terms social protection available to their inhabitants. At 61.1%, Ireland’s growth in social protection expenditure per capita was the highest by some way3. It was more than one third higher than that of Bulgaria which is ranked second with growth of 45.7%. Only 3 other countries – Norway, Malta and Romania – had growth of 20% or higher. During this period, the UK’s growth in expenditure was 7.4% - only 7 out of the 30 countries for which data are available reported lower expenditure growth.
In the most recent year for which data are available, the highest spending country was Luxembourg with expenditure of 14,226 PPS per capita. However, Luxembourg is an unusual case given the high proportion of its workforce that is non-resident. Norway had the second largest with expenditure of 11,310 PPS per capita, 45.1% higher than that of the UK. Only 2 other countries - the Netherlands and Denmark - had expenditure that exceeded 10,000 PPS per capita.
The UK was thirteenth in terms of the amount spent. The UK’s expenditure on social protection was 7,795 PPS per capita in 2013 - 15.3% above the average of the 30 countries for which data were available. It is of interest to compare the UK’s position with the three other G74 members among the selected countries. The UK’s expenditure was lower than Germany and France which were 9,469 PPS per capita (21.5% above the UK) and 9,223 per capita (18.3% above the UK), respectively. Italy, on the other hand, spent 7,614 PPS per capita on social protection, 4.9% less than the UK.
Notes for international comparisons
Eurostat give a more complete definition: Social protection encompasses interventions from public or private bodies intended to relieve households and individuals of the burden of a defined set of risks or needs, provided that there is neither a simultaneous reciprocal nor an individual arrangement involved.
For reasons of data availability, Croatia, Serbia and Turkey are not used in the calculation of this average.
The data for Ireland may be revised at a later date.
The G7 is a group of the seven major advanced economies as reported by the International Monetary Fund. Its members are France, Germany, Italy, United Kingdom, Canada, Japan and the USA.
4. Old Age social protection spending
The largest expenditure category in 2013 was Old Age, accounting for 42% of all social protection expenditure. In cash terms this was just over £204 billion.
Figure 3 provides 2 different perspectives on UK expenditure on old age social protection between 2007 and 2013. On the left-hand axis, expenditure is reported as the proportion of Gross Domestic Product (GDP). GDP measures the income produced within a country during a particular period and can be used as a proxy for the nation’s ability to spend on social protection. The right-hand axis ranks the UK among the selected countries in terms of old age social protection per capita. To allow meaningful comparisons, these ranks are based on expenditure measured in Purchasing Power Standards (PPS).
Figure 3: United Kingdom expenditure on old age social protection, 2007 to 2013

Source: Eurostat, Office for National Statistics
Notes:
- The ranks are based on expenditure measured in Purchasing Power Standards.
- Data for 2013 were not available for Denmark, Ireland, Greece, Netherlands, Poland, Romania, Turkey and Iceland. The UK’s rank for this year is calculated using 2012 observations for these eight countries.
Download this image Figure 3: United Kingdom expenditure on old age social protection, 2007 to 2013
.png (21.2 kB) .xls (21.5 kB)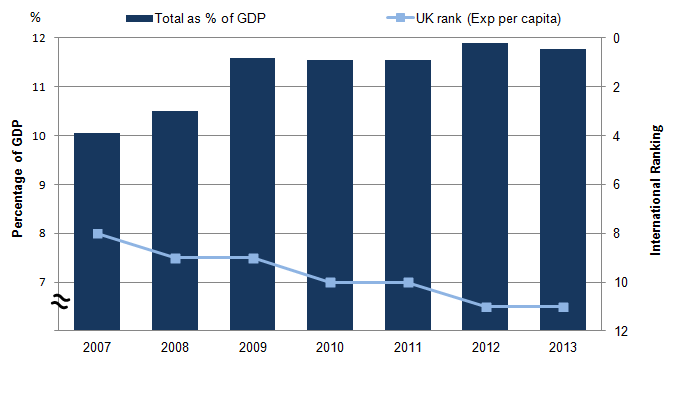
In 2007, the UK spent the equivalent of 10.1% of GDP on Old Age social protection. In terms of PPS per capita, this was the eighth highest of the selected countries.
In 2008, expenditure as a proportion of GDP rose to 10.5%. In terms of expenditure per capita, this expenditure was the ninth highest of the selected countries. The following year, 2009, saw the period’s sharpest increase in the proportion of GDP spent, rising by 1.1 percentage points to 11.6%. There were 2 drivers to this change. GDP fell by 2.2% and expenditure on old age social protection rose by 7.8%1. The UK remained in ninth place in terms of its expenditure per capita.
In 2010, the UK’s ranking fell one place to tenth. In that year, expenditure as a proportion of GDP remained at 11.6%. This was during the largest rise in GDP over the period (4.7%) and an increase of 4.3% in spending in the old age category. During 2011, spending as a proportion of GDP fell by 0.1 percentage points to 11.5%. Both GDP and expenditure rose by slightly more than 4.0%. The UK’s rank remained unchanged at tenth.
In 2012, expenditure as a proportion of GDP rose by 0.4 percentage points to 11.9%. This was a year when GDP and total expenditure on old age social protection rose by 2.8% and 5.9% respectively.
The large increase in old age social protection can perhaps be explained by changes in the basic state pension. From April 2012 onwards, the basic state pension in the UK, the largest single component of old age social protection expenditure, was subject to a new rule known as the "triple guarantee". In that and following years, it was increased by whichever was the highest of 3 percentages:
the growth in average earnings, as measured by the Average Weekly Earnings Index
price inflation (as measured by the Consumer Price Index)
2.5%
In 2012, the UK’s rank among the selected countries in terms of the amount spent on old age social protection fell to eleventh. Finally, in 2013, there was a small drop in the proportion of GDP spent in the old age category, to 11.8%.During this period, GDP recorded its second strongest growth of the period at 4.2%, while there was an increase in expenditure on old age protection of 3.1%.
Figure 4 illustrates the change over time in the number of recipients of old age social care protection. It shows that the total number of recipients grew every year during the period. This was particularly notable during 2008 and 2009: during these years, the number of recipients grew by 1.8% and 2.1% respectively. However, in the remaining years, growth in the total number of recipients declined, falling to 0.5% in 2013.
Figure 4: Growth in Number of Old Age Beneficiaries in the United Kingdom, 2008 to 2013
Source: Eurostat
Download this chart Figure 4: Growth in Number of Old Age Beneficiaries in the United Kingdom, 2008 to 2013
Image .csv .xlsTaking the period from 2008 and 2013 as a whole, the number of recipients of old age expenditure grew by 5.9%, from 12.5 million to 13.2 million. The Office for Budget Responsibility (OBR) reported on this issue in 2014 stating:
"More recently, the size of the population above the State Pension Age has picked up sharply as the large post-World War II baby-boom generation has entered this age group. All else equal, this change in age structure has increased the number of people qualifying for the basic state pension."2
The growth of 5.9% in the number of recipients was driven by an increase of 16.0% in the number of men in this category, and offset by a 0.2% fall in the number of women. This divergence was mainly driven by changes to the state pension rules introduced in 2010. In that year incremental increases in state pension age for women designed to bring the state pension of females into line with that of males by 2018 were introduced. This has impacted significantly on the number of female recipients of old age benefits. The OBR estimates that the 2018 figure for the number of pensioners will be 1.8 million lower because of this change.
There were approximately 7.8 million female beneficiaries in 2008 and 2013. However, as can be seen from Figure 4, this number varied markedly during the intervening years. Female beneficiaries rose in 2008 and in 2009, by 1.7 % in both years. This was followed in 2010 by slower growth of 0.4%. This was the last year of positive growth. For the remainder of the period there was an increasing year-on-year decline in the number of female old age beneficiaries, falling by 0.5% in 2011, 0.7% in 2012 and by 1.0% in 2013.
The number of men receiving old age care expenditure rose in each of the 6 years, starting with 2.1% growth in 2008 and 2.9% the following year. Growth slowed to a rate just above that of 2008 in 2010, to 2.2%. This was followed by the 2 strongest annual increases in the number of male old age beneficiaries of the period with growth of 3.2% in 2011 and 3.9% in 2012. Finally, in 2013, growth fell to its 2009 level of 2.9%.
Notes for old age social protection spending
In this section where old age expenditure as a percentage of GDP is considered, calculations are based on nominal estimates.
OBR Welfare Trends Report 2014.
5. Disability social protection
Table 2 highlights the UK ranking among the selected countries in terms of expenditure in each of the 8 ESSPROS categories for the year 2012. The ranks are calculated using Purchasing Power Standards (PPS) per capita to ensure a meaningful international comparison.
Table 2: Ranking of United Kingdom expenditure on ESSPROS categories (PPS per capita), 2012
| Category | UK Rank |
| Housing | 1 |
| Family and Children | 9 |
| Social Exclusion nec | 9 |
| Old Age | 11 |
| Sickness | 12 |
| Disability | 14 |
| Unemployment | 19 |
| Survivors | 31 |
| Total Social Protection Expenditure | 13 |
| Source: Eurostat | |
Download this table Table 2: Ranking of United Kingdom expenditure on ESSPROS categories (PPS per capita), 2012
.xls (17.4 kB)The 2 lowest ranking categories are Unemployment and Survivors. The rank of Unemployment reflects the relatively low unemployment rates of the UK in that year. Benefits in the Survivors category are paid to those in need due to the death of a breadwinner. They account for less than 1% of social protection expenditure.
The third lowest ranking was that of the Disability category. The UK was fourteenth of the 33 selected countries. The Disability category of ESSPROS records expenditure on cash benefits and goods and services for disabled people below retirement age1. Benefits paid to disabled pensioners and for medical care are recorded elsewhere within the ESSPROS dataset.
In 2013, the UK spent £30 billion on benefits in the Disability category. This accounted for 6.3% of total social protection expenditure for that year.
During the period 2007 to 2013, the proportion of the population receiving benefits in the disabled category remained fairly constant at 3.2% in 2007 to 3.3% in 2013.
Figure 5 illustrates expenditure on Disability social protection. The left hand axis denotes the amount spent per recipient within the UK each year. To ensure a meaningful comparison over time, expenditure has been deflated to 2013 prices throughout this section2.
The right hand axis highlights the UK’s rank among the selected countries in terms of its expenditure per capita on disability benefits. The data underpinning these rankings has been adjusted to take purchasing power into account. Expenditure per recipient was £16,700 in 2007 and changed little during 2008 and 2009. The UK had the eleventh highest expenditure per capita in 2007 and 2008, but fell to twelfth place in 2009.
Figure 5: United Kingdom expenditure on Disability Category of ESSPROS, 2007 to 2013

Source: Eurosta
Notes:
- The ranks are based on expenditure measured in Purchasing Power Standards.
- Data for 2013 were not available for Denmark, Ireland, Greece, Netherlands, Poland, Romania, Turkey and Iceland. The UK’s rank is calculated using 2012 observations for these eight countries.
Download this image Figure 5: United Kingdom expenditure on Disability Category of ESSPROS, 2007 to 2013
.png (19.9 kB) .xls (17.9 kB)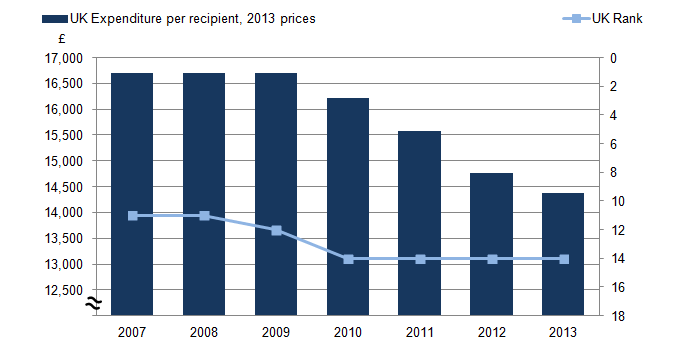
In 2010, there was a drop of £491, or 2.9%, in expenditure per recipient. As a result, the UK’s ranking fell 2 places to fourteenth. There were further falls in expenditure per recipient in 2011, 2012 and 2013 of 3.9%, 5.2% and 2.7% respectively. This appears to be consistent with experiences of other countries as the UK continued to be ranked fourteenth despite these decreases in disability expenditure.
Notes for disability social protection
The ESSPROS Manual describes disability as the full or partial inability to engage in economic activity or to lead a normal life due to a physical or mental impairment that is likely to be either permanent or to persist beyond a minimum prescribed period.
The consumer price index has been used as a deflator.
6. Housing social protection
In 2013, the United Kingdom spent £394 per capita in the housing category of social protection, which is the equivalent of 1.5% of GDP. This was the highest expenditure per capita on housing social protection of the selected countries.
The Department for Work and Pensions publishes data1 that show Great Britain’s housing benefit expenditure and number of beneficiaries in terms of different categories of claimant2. These estimates indicate a real terms growth in spending on Housing Benefit of 34.7% between 2007/2008 and 2013/2014.
Figure 6 examines the number of claimants receiving housing benefits in 2007/2008 and in 2013/2014, by claimant group. In both years the ranking of the categories in terms of the percentage of total housing benefits recipients was the same. Interestingly the 2 largest categories had a decreased share in 2013/2014 compared with 2007/2008, the middle category was broadly unchanged and the two smallest categories’ shares increased.
Figure 6: Housing Beneficiaries by Claimant Group, Great Britain, 2007/2008 to 2013/2014
Source: Department for Work and Pensions
Notes:
- This chart is based on Financial year data.
Download this chart Figure 6: Housing Beneficiaries by Claimant Group, Great Britain, 2007/2008 to 2013/2014
Image .csv .xlsFigure 6 shows that the largest proportion of recipients was in the Over Pension Credit Qualifying Age category. They accounted for 29.9% of the total claimants in 2013/2014, a decrease of 7.4 percentage points compared with 2007/2008. The next largest categories in both years were the Long-term Sick and Disabled and Lone Parents, accounting for 23.9% and 20.8% in 2013/2014 respectively. Their shares of total number of claimants remained relatively constant between 2007/2008 and 2013/2014, decreasing by 0.9 and 0.3 percentage points respectively.
The Unemployed category experienced the greatest increase between 2007/2008 and 2013/2014. These beneficiaries grew as a proportion of the total from 7.5% in 2007/2008 to 10.0% in 2013/2014. The Others category is comprised mainly of low income workers. Its share grew, albeit to a lesser extent than Unemployed, from 9.2% in 2007/2008, to 15.3% in 2013/2014.
Notes for housing social protection
Summer Budget 2015 Expenditure and Caseloads Forecast
The DWP sourced data used are based on financial years.
The DWP figures used in this analysis do not include Discretionary Housing Payments. However, these payments are included in the ESSPROS housing figures. The resultant difference is less than 1% in expenditure terms.
3. Social protection spending in the UK
Social protection benefits can either be in cash or in kind. Benefits in kind include hospital stays, free school dinners and home care. In 2013, the latest year for which data are available, over £482 billion was spent on social protection in the UK, an increase of 1.7% on the previous year and equivalent to 28% of GDP.
Table 1: Social Protection Expenditure in the United Kingdom in 2012 and 2013
Download this table Table 1: Social Protection Expenditure in the United Kingdom in 2012 and 2013
.xls (25.1 kB)As can be seen from Table 1, cash benefits accounted for approximately £292 billion, or 60.5%, of social protection. The remaining benefit in kind expenditure was over £190 billion, or 39.5% of the total. At 2.0%, the increase in spending on benefits in kind was 0.5 percentage points higher than that of cash benefits (1.5%).
Under the ESSPROS system, social protection expenditure is divided into 8 broad categories. Figure 2 illustrates the proportion of total spend accounted for in these 8 categories in 2013. For the sake of clarity 3 of these categories – Social Exclusion not elsewhere classified, Unemployment and Survivors have been recorded in a single "Other" category. Each of these 3 accounted for less than 3% of expenditure.
Figure 2: United Kingdom Social Protection Expenditure by Category, 2013
Source: Eurostat
Notes:
Download this chart Figure 2: United Kingdom Social Protection Expenditure by Category, 2013
Image .csv .xlsThe remainder of this article will concentrate on the ESSPROS categories of Old Age, Disability and Housing. The international comparison within these categories should be interpreted with caution, as the recipients of benefits under one of these categories are likely also to receive benefits under other categories. For example, pensioners in a country that spends less than the average on social protection in the old age category might, in fact, enjoy more social protection if, for example, their country provides free healthcare.
Nôl i'r tabl cynnwys